The analytics department your business never had — run by one operator and a fleet of AI agents.
Reporting, automation, and decision infrastructure — live in production, not in a deck — tested, reconciled, and audited, so every number holds up under scrutiny.
Microsoft Certified Power BI Analyst (PL-300)· Chicago & Remote
A dashboard is a one-page status screen. These are analytical platforms — engineered data models, ML scoring, geospatial pipelines, and deliberate storytelling that carries a decision-maker from question to answer.
Actual production pages, full frame — advances on its own; arrows to browse, click through to go deeper.
15 years of Fortune 100 delivery — now the rigor of an enterprise BI team, at the speed and cost of one consultant.
Enterprise
BI & Reporting
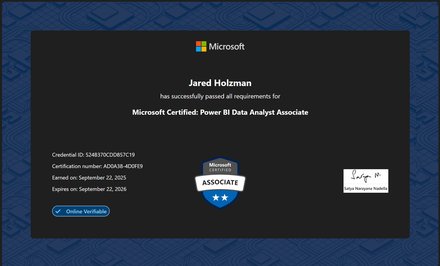
Executive reporting, KPI frameworks, and the BI infrastructure designed around how leadership actually makes decisions — not how data happens to be structured. End-to-end Power BI development: semantic model design, advanced DAX, Power Query transformation pipelines, and geospatial analysis. Microsoft Certified PL-300.
Reporting Automation
& Workflow Design
Converting the manual, repetitive work around your data — report assembly, data prep, file and document handling, reconciliations — into automated pipelines that run hands-off, on schedule. Built on Power BI scheduled refresh and data gateways, agentic ETL, and AI agents that take over the steps a person used to do by hand — so your team spends time on decisions, not busywork.
Workforce, Financial & Operational
Analytics
Connecting people, cost, and operational data into a single coherent picture that executives can act on. Whether that's headcount and location strategy, financial forecasting and vendor spend, delivery performance, or the operational metrics your business runs on — I build the analytical foundation that turns disconnected data into decisions.
Strategic Analytics
Advisory & Planning
Not just the reports — the decisions. I've partnered directly with CFOs and SVPs: orchestrating headcount forecasts for a 55,000-person workforce across 20 business units, planning growth and reductions location by location, and shaping the roles needed to launch a $1B+ transformation program. Advisory at the altitude where the numbers become the org chart.
Delivered agentically. I build all of this by directing a fleet of AI agents — research, data engineering, report development, QA, and documentation — at a speed a solo consultant couldn't reach a year ago, with the enterprise governance to keep every number auditable: automated tests, reconciliation checks, and a human in the loop on anything ambiguous. Enterprise speed, without the AI slop.
Open to project engagements, fractional analytics leadership, and the right full-time seat — let's find the shape that fits.
A property-management firm, a multi-location operator, a small-cap, a private-equity portfolio, or a Fortune 100 enterprise — the size doesn't matter. The signals do.
Signal 01
Month-end reporting burns days — disconnected systems and spreadsheets, stitched together by hand.
Signal 02
There's no single source of truth — everyone trusts their own version of the numbers.
Signal 03
Decisions get made on data that's already a week stale.
Signal 04
One person "owns the spreadsheet," and the business is exposed if they leave.
Signal 05
Every leadership question is a fire drill — a one-off answer built from scratch, then thrown away.
The patternYou don't want another IT project. You want the reporting and automation to work — fast, without hiring a team to maintain it.
Built to scaleStart where you are — but what I build is a platform, not a patch. It's architected to scale with you as you add locations, data, and users, so growth never means tearing it down and starting over.
How I operate
Embed. Ship. Compound.
The same operating model whether I'm embedded for a build, holding a fractional seat, or running the function outright: learn fast, ship visibly, build capability that lasts.
01 · Embed
Learn the business
I start inside your team, on your real systems — learning how the business actually runs and how the data really flows.
02 · Ship
Working software, fast
Real automation and reports in weeks, not a six-month discovery deck — delivered in increments you can see, correct, and put to work right away.
03 · Compound
Capability that keeps building
Every build documented and transferable — your team runs what's already live, and I stay on to extend it as the business grows.
The gate — AI speed without the AI slop: automated tests · reconciliation · audit trail · work your team can run without me. Nothing ships on red, nothing you can't own.
PROJECT · FRACTIONAL · FULL-TIME — one model, three shapes
Portfolio
Featured Work
From a flagship agentic data product to Fortune-100 enterprise platforms — spanning BI, automation, ML, and the analytics leadership runs on.
Cannabis Markets Intelligence Platform
SELF-FUNDED · FLAGSHIP
A daily-updating intelligence platform for the entire US cannabis market — five ETFs, the operators behind them, 13,129 geocoded dispensaries, insider and congressional money, and the reform moving the market. Its flagship lane makes a structurally complex, swap-based ETF legible, surfacing every swap-to-physical conversion as it happens (the exact case naive trackers get wrong). Built end-to-end by directing a fleet of AI agents — entirely in natural language, without writing a single line of code — on enterprise-grade controls: an idempotent pipeline, 3,910 automated tests, a 21-gate pre-publish audit, and a human in the loop on anything ambiguous.
Power BI Semantic ModelDAXPythonAutomated TestingVersion ControlAI Agent Orchestration
▶ Interactive Report● Live · 6 sections
Self-funded personal project · no client · not investment advice
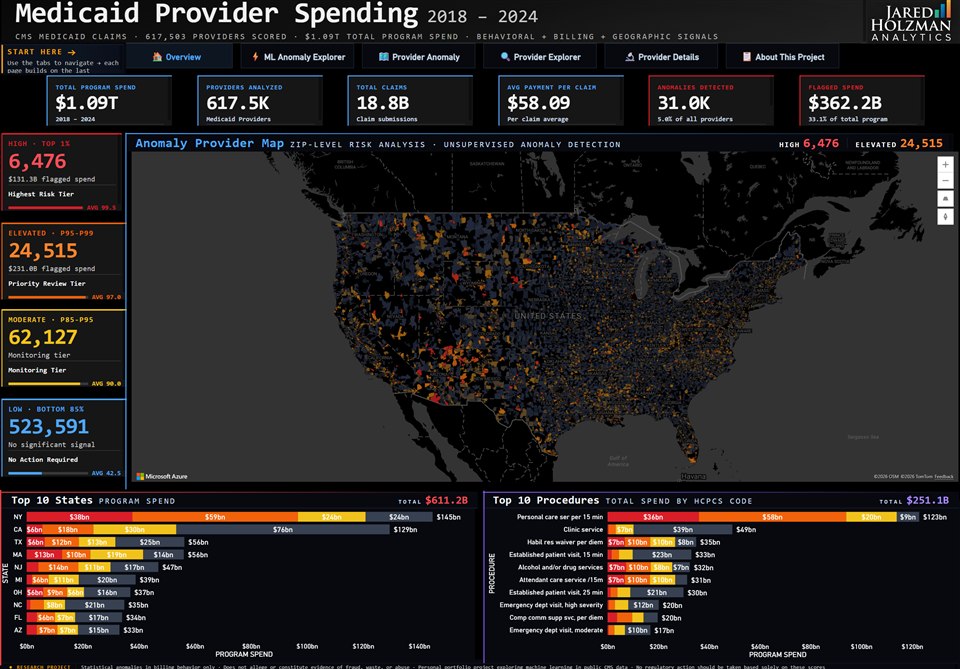
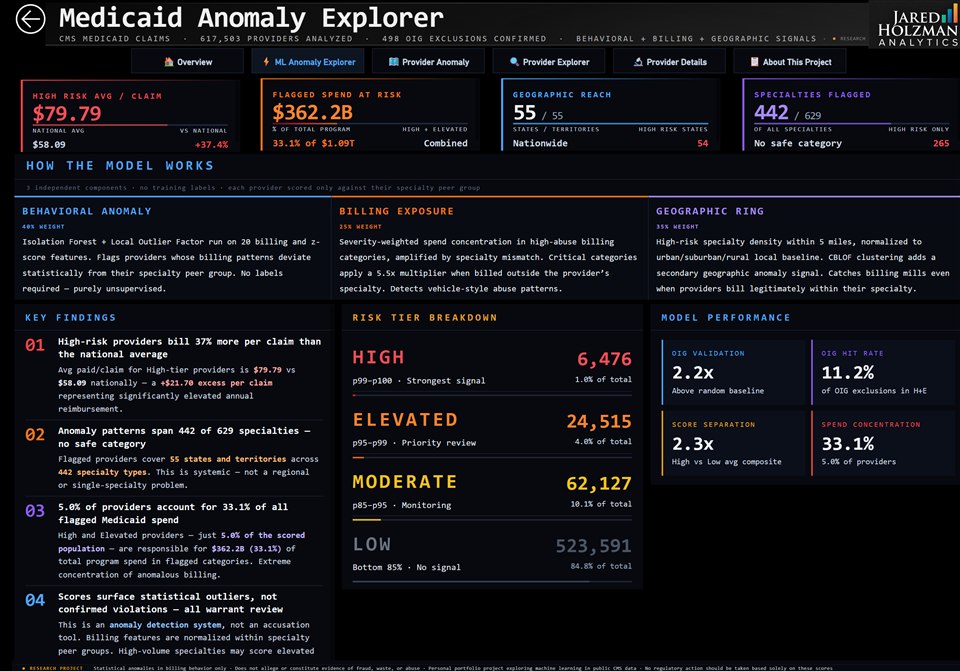
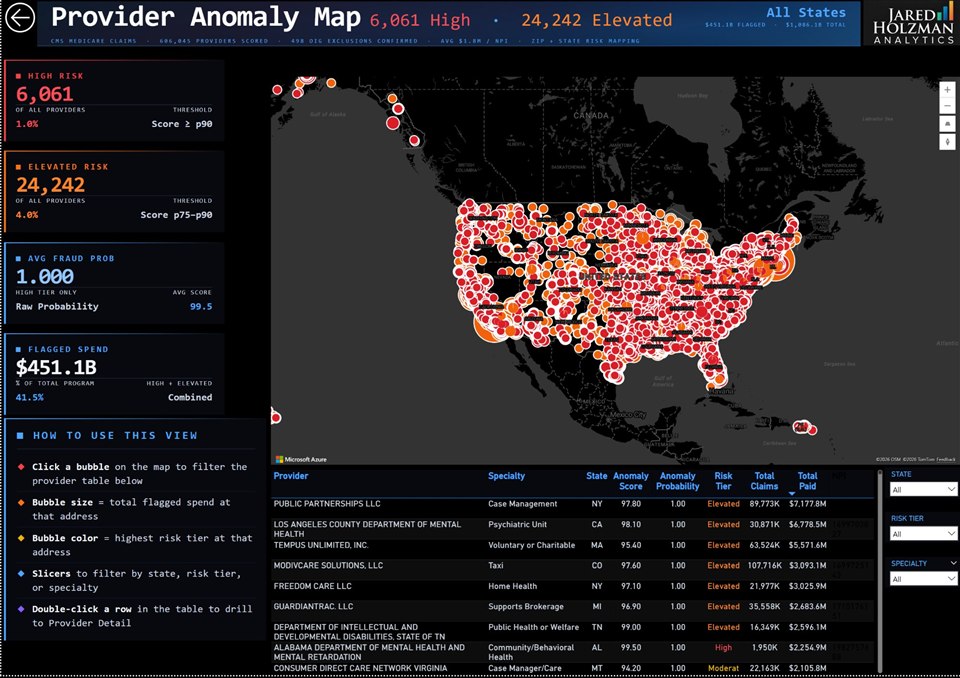
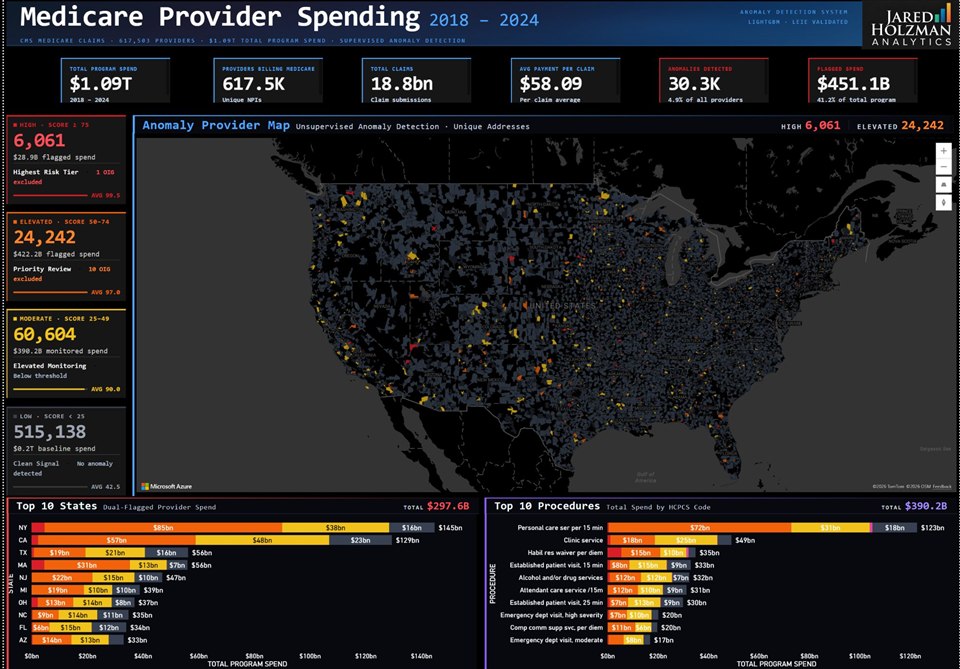
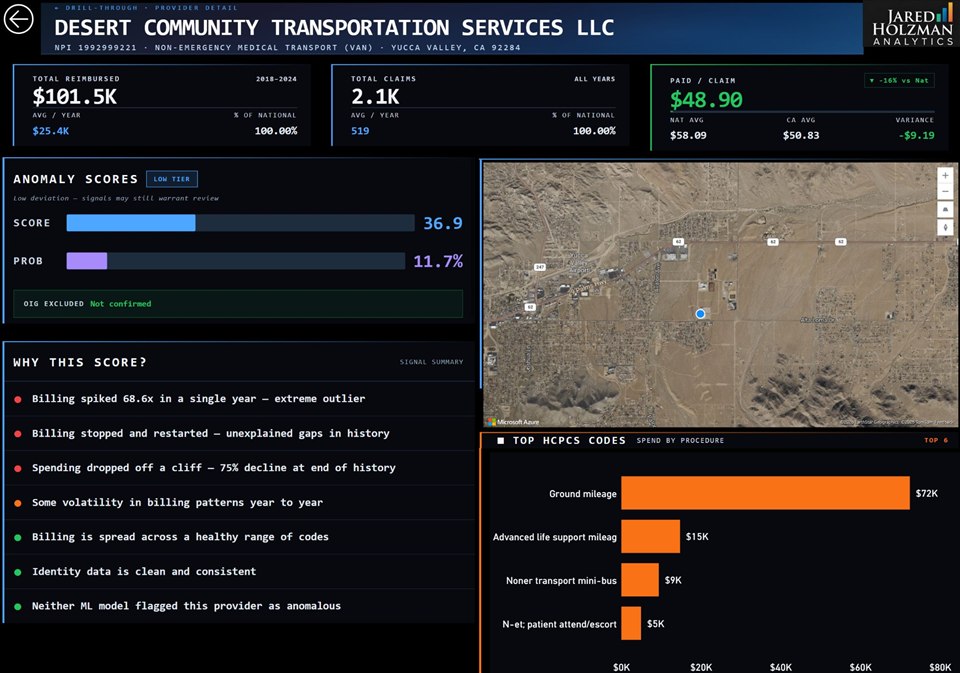
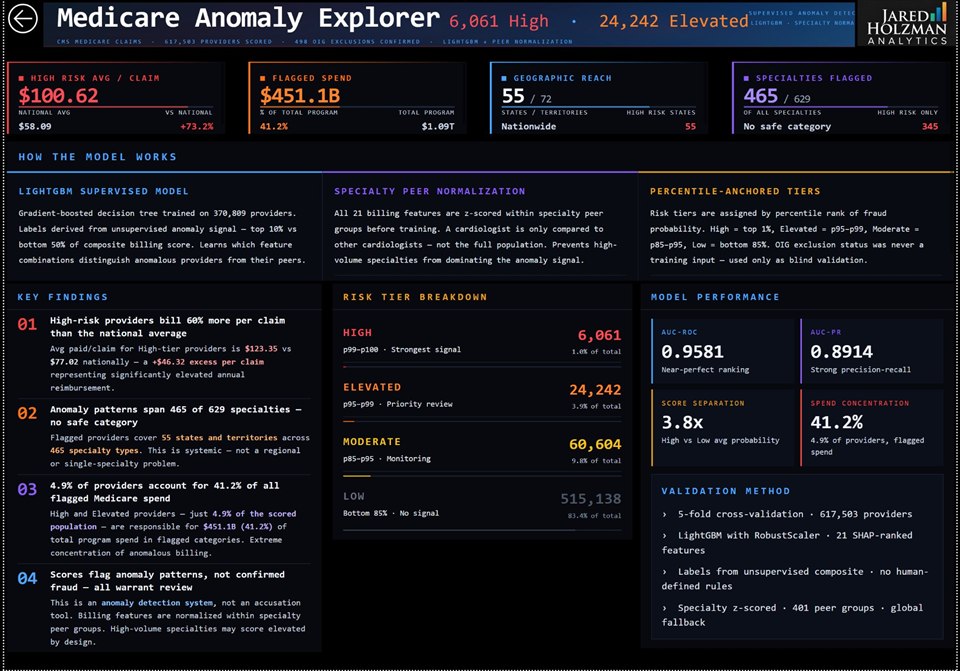
An end-to-end ML anomaly-detection platform built on publicly available CMS Medicaid claims. Analyzes $1.09T in Medicaid program spend across 617,503 providers (2018–2024) to surface statistical billing anomalies using an unsupervised 3-component ensemble — Behavioral Anomaly (IF+LOF), Billing Exposure, and Geographic Ring — with specialty peer normalization and percentile-anchored risk tiers. OIG exclusion cross-validation yields 2.2x lift above random baseline. Risk scores reflect statistical outliers in billing behavior only and do not indicate or allege wrongdoing. Built end-to-end with Claude (via Model Context Protocol) and Grok.
Power BIPythonDAXAzure MapsUnsupervised EnsembleAnomaly DetectionOIG / LEIE ValidationHealthcare AnalyticsClaude via MCP
▶ Live Interactive ReportPowered by Microsoft Power BI · Use tabs inside to navigate all 6 pages
Powered by Microsoft Power BI · Opens inline
Research project only · Statistical outliers in billing behavior · Does not indicate or allege fraud · No regulatory action should be taken based solely on these scores
A first-principles ML engineering build, documented end-to-end. Watch six disconnected government datasets get assembled into a geocoded, scored, and visualized analytics platform — from raw Parquet and CSV government data through a Python anomaly detection pipeline to a fully custom Power BI report. Built with Claude (via Model Context Protocol) and Grok.
The centralized platform tracking 55,000+ employees and every site — headcount forecasts orchestrated with the CFO’s office across 20 business units, behind consolidation decisions worth hundreds of millions.
$244MSavings enabled
55K+Employees tracked
Technology Finance
Technology Finance & Spend Intelligence
From inflation-adjusted guesswork to product-level truth: contracts, licenses, and duplicated spend surfaced across the enterprise technology budget.
$330M+Spend made visible
$1.2BTech budget served
Transformative Growth
Agile Delivery & Product Launch Forecasting
Inside the company’s $1B+ Transformative Growth program — advising SVPs on the roles needed to launch, and building the delivery analytics the rollout ran on.
$1B+Transformative Growth program supported
Also at Allstate: Workforce Visibility · Product Analytics · Pre-Transformation Feasibility & Financial Modeling
15 years at Allstate building analytics platforms for Fortune 100-scale decisions — from a $1.2B technology finance organization to enterprise-wide workforce strategy and the launch of a new direct-to-consumer insurance product. Now open to project engagements, fractional analytics leadership, or the right full-time seat.
I spent nearly 15 years at Allstate solving problems that didn't have obvious owners, the kind where the answer required building something that didn't exist yet.
It started in the $1.2B technology finance organization, where I built the financial infrastructure that gave senior leadership their first real visibility into $330M+ in enterprise hardware and software spend. Vendor asset portfolios built from raw purchase order data, automated executive decks that pulled SAP actuals and refreshed projections without manual intervention, and headcount forecasting that connected people costs to spend decisions. The work wasn't about reports. It was about giving the organization a foundation it could actually make decisions from, and then automating that foundation so it ran itself.
From there I moved into workforce strategy and analytics, where my work connected directly to Allstate's Transformative Growth agenda — the company's push to reinvent itself as a low-cost digital insurer. Working directly alongside the CFO, I built the headcount tracking, location modeling, severance forecasting, and real estate analysis that guided decisions across 55,000+ employees and 150+ corporate sites.
When COVID-19 hit, that foundation proved its value immediately. Selected for an SVP-led task force, I coordinated critical role designation across every business unit — a structured forecasting exercise that determined only 3-5% of employees required on-site presence. The work across ERS and the COVID task force directly enabled $244M in annual real estate savings and the sale of Allstate's Northbrook headquarters.
What Transformative Growth was building toward was ASC: Affordable, Simple, Connected — Allstate's new direct-to-consumer auto and property insurance product. Getting there required replacing decades of legacy systems, standing up a new product organization, and shifting the entire technology delivery model from Waterfall to Agile at enterprise scale.
That shift created an immediate problem. The reporting infrastructure that existed was built for Waterfall, and Agile requires a completely different set of KPIs. There was no platform, no framework, and no playbook. I built it — starting with an interim Excel and PowerPoint scorecard to bridge the gap, then scaling to Allstate's first end-to-end Agile delivery analytics platform and a launch forecasting model that gave the board a clear picture of when ASC would be market-ready.
Building the platform also surfaced a significant data quality problem. Agile tooling data was inconsistently maintained across teams, undermining delivery metrics and forecasting. I worked with the tooling team to enforce required fields in Digital.ai Agility and built a data-validation report for Scrum Masters to resolve issues in real time, establishing a culture of data ownership that hadn't existed before.
Once ASC launched, the work shifted again. I built Allstate's first enterprise analytics platform for ASC product performance: a 10+ metric KPI framework and ZIP code-level geospatial analysis in ESRI ArcGIS, giving executives their first direct comparison of ASC against legacy products across every market.
Concept to market, I was there for every chapter. The problems were complex, the scale was real, and the work had to hold up. That's what I bring to your organization.
Bachelor of Business Administration, Finance & Management · Certificate in Entrepreneurial Management
Impact
Career Overview
A visual walkthrough of the work, outcomes, and scope behind 15 years of enterprise analytics.
Testimonials
What People Say
Feedback from colleagues and stakeholders I've built for.
I had the opportunity to work closely with Jared at Allstate. He's flexible, easy to collaborate with, and always willing to think through different approaches to get to the best views to help stakeholders make informed, data-driven decisions. He played a key role in supporting a large initiative's recognition program, helping drive transparency and consolidation across resources — partnering closely with the team to identify and recognize roughly 1,600 contributors while navigating funding, staffing, and data challenges. Jared also built the Agile delivery analytics and forecasting models that gave leadership a clear, real-time view of progress, risks, and delivery outlooks, and was the go-to partner for complex data analysis and Excel modeling. Jared is responsive, thoughtful, and a great teammate. I'd gladly work with him again and highly recommend him.
Susan TaltonDigital Product Manager · Allstate
View Profile
I had the pleasure of partnering with Jared on several strategic initiatives focused on enterprise resource strategy, resource planning, agile metrics, and overall operational effectiveness. Jared consistently demonstrated strong analytical thinking and a structured, results-driven approach to problem-solving. His ability to connect data-driven insights with strategic goals made him a trusted thought leader on our team. Beyond his technical expertise, Jared brought exceptional organization, focus, and collaboration to every project. He challenged us to think differently and always sought ways to improve processes for greater impact.
I had the pleasure of working with Jared for five years, during which he consistently demonstrated exceptional skill in data analysis, data visualization, and reporting. Jared took ownership of the Agile Executive Scorecard from me, automating and enhancing it to create a more scalable and efficient reporting process that increased visibility for leadership. Together, we built a range of highly visible dashboards and reports for enterprise risk management, agile delivery metrics, and other key business areas regularly used by senior leadership and C-suite stakeholders. He has an outstanding ability to translate complex data into clear, visually compelling insights that drive informed decision-making.
Troy MalikSenior IT Portfolio Manager · Ulta Beauty
View Profile
I've had the pleasure of working with Jared for several years on critical, high visibility projects and I can confidently say that he is an exceptional data and analytics professional. Jared has expertise in Power BI, Excel, data fundamentals, and consistently turns complex datasets into clear, actionable insights that drive smart business decisions. Beyond his technical skills, he is reliable, detail-oriented, and always willing to go the extra mile to ensure accuracy and impact.
I worked closely with Jared Holzman as a key stakeholder to drive resource transparency within a transformative growth program at Allstate. Jared began with detailed Excel-based analysis and modeling to understand the full set of resources supporting the delivery of a new product. He went on to design and implement a Roster Dashboard that provided clear visibility into staffing, team capabilities, and resource allocation across this large-scale, enterprise-wide transformation. This solution enabled Scrum Masters to keep team rosters up to date in near real time and helped leadership better understand team capabilities, strategic alignment, and whom to engage for specific workstreams. Jared brings strong data analysis and problem-solving skills, along with the ability to translate complex information into clear, actionable insights. His contributions created meaningful visibility and alignment, and his skill set would be a valuable asset to any organization. I would highly recommend him.
During my time at Allstate, I had the opportunity to work closely with Jared. He is a highly skilled technical finance professional who consistently bridges complex technical concepts with business needs. Jared played a key role in providing insights that informed strategic, technical, and business decisions, enabling teams to make well-grounded choices and achieve stronger outcomes. His insight, reliability, and ability to translate data into actionable strategy made him a valuable partner and a trusted resource.
Have a Power BI project that needs to be done right? Standing up an analytics function? Drowning in manual month-end reporting? I'd love to hear what you're working on.